
Die vier synthetischen Tests des AS SSD-Benchmarks ermitteln die sequentielle und zufällige Lese- und Schreibgeschwindigkeit unserer Testprobanden. Diese Tests werden ohne Nutzung des Betriebssystem-Caches durchgeführt. In den sequentiellen Tests misst das Programm wie lange es dauert, eine 1 GB große Datei zu lesen respektive zu schreiben. Im 4K-Test wird die Lese- und Schreibleistung bei zufällig ausgewählten 4K-Blöcken ermittelt. Der 4K-64-Thrd-Test entspricht dem 4K-Prozedere, nur dass in diesem Fall die Lese-und Schreiboperationen auf 64 Threads verteilt sind. Damit wird der typische Start eines Programms bzw. Prozesses simuliert.
Zuletzt wird noch die Zugriffszeit der SSD ermittelt, wobei der Zugriff beim Lesen über die gesamte Kapazität der SSD (Fullstroke) ermittelt wird. Der Schreibzugriffstest erfolgt mit einer 1 GB-Testdatei.
| read, Mittelwert | |
| Plextor M5S, 256 GB | 522,59 |
| ADATA XPG SX900, 256 GB | 517,45 |
| OCZ Vector 150, 120 GB | 515,75 |
| Plextor M5 Pro Xtreme, 128 GB | 514,33 |
| OCZ Vector 150, 480 GB | 513,37 |
| Samsung SSD 840 EVO, 1 TB | 512,54 |
| Plextor M5 Pro Xtreme, 256 GB | 507,49 |
| OCZ Vertex 460, 480 GB | 504,75 |
| OCZ Vertex 460, 240 GB | 504,34 |
| Crucial M500 SSD, 480 GB | 498,30 |
| Intel SSD 335 Series, 240 GB | 496,66 |
| Plextor M6S, 256 GB | 488,22 |
| Kingston HyperX 3K SSD, 120 GB | 451,62 |
| OCZ ARC 100, 240 GB | 442,51 |
| ADATA Premier Pro SP900, 256 GB | 403,74 |
| Kingston SSDNow V300, 120 GB | 176,63 |
| Angaben in MB/sec (mehr ist besser) | |
| write, Mittelwert | |
| Samsung SSD 840 EVO, 1 TB | 498,15 |
| OCZ Vector 150, 480 GB | 497,27 |
| OCZ Vertex 460, 240 GB | 497,05 |
| OCZ Vertex 460, 480 GB | 494,79 |
| Plextor M6S, 256 GB | 437,05 |
| Plextor M5 Pro Xtreme, 256 GB | 435,01 |
| Crucial M500 SSD, 480 GB | 424,91 |
| OCZ Vector 150, 120 GB | 412,84 |
| OCZ ARC 100, 240 GB | 410,77 |
| Plextor M5S, 256 GB | 378,90 |
| ADATA Premier Pro SP900, 256 GB | 355,60 |
| Intel SSD 335 Series, 240 GB | 312,67 |
| ADATA XPG SX900, 256 GB | 310,99 |
| Plextor M5 Pro Xtreme, 128 GB | 303,84 |
| Kingston HyperX 3K SSD, 120 GB | 236,80 |
| Kingston SSDNow V300, 120 GB | 133,43 |
| Angaben in MB/sec (mehr ist besser) | |
| read, Mittelwert | |
| Samsung SSD 840 EVO, 1 TB | 36,28 |
| Plextor M5 Pro Xtreme, 128 GB | 30,30 |
| Plextor M5 Pro Xtreme, 256 GB | 29,94 |
| Plextor M6S, 256 GB | 29,89 |
| Plextor M5S, 256 GB | 28,74 |
| OCZ Vector 150, 480 GB | 26,92 |
| OCZ Vertex 460, 480 GB | 26,78 |
| OCZ ARC 100, 240 GB | 24,87 |
| Crucial M500 SSD, 480 GB | 24,58 |
| OCZ Vector 150, 120 GB | 23,37 |
| OCZ Vertex 460, 240 GB | 22,82 |
| Intel SSD 335 Series, 240 GB | 22,51 |
| ADATA Premier Pro SP900, 256 GB | 20,99 |
| ADATA XPG SX900, 256 GB | 19,74 |
| Kingston HyperX 3K SSD, 120 GB | 19,24 |
| Kingston SSDNow V300, 120 GB | 15,78 |
| Angaben in MB/sec (mehr ist besser) | |
| write, Mittelwert | |
| OCZ Vertex 460, 240 GB | 77,63 |
| Samsung SSD 840 EVO, 1 TB | 74,25 |
| OCZ Vector 150, 120 GB | 72,60 |
| Crucial M500 SSD, 480 GB | 72,39 |
| ADATA Premier Pro SP900, 256 GB | 71,56 |
| Intel SSD 335 Series, 240 GB | 70,46 |
| Kingston SSDNow V300, 120 GB | 69,36 |
| OCZ Vector 150, 480 GB | 68,20 |
| Kingston HyperX 3K SSD, 120 GB | 67,64 |
| OCZ Vertex 460, 480 GB | 67,34 |
| Plextor M5 Pro Xtreme, 256 GB | 65,23 |
| Plextor M6S, 256 GB | 64,67 |
| Plextor M5 Pro Xtreme, 128 GB | 64,45 |
| OCZ ARC 100, 240 GB | 63,53 |
| Plextor M5S, 256 GB | 59,29 |
| ADATA XPG SX900, 256 GB | 56,26 |
| Angaben in MB/sec (mehr ist besser) | |
| read, Mittelwert | |
| Samsung SSD 840 EVO, 1 TB | 371,64 |
| Plextor M5 Pro Xtreme, 256 GB | 367,00 |
| OCZ Vector 150, 480 GB | 353,96 |
| Plextor M6S, 256 GB | 353,72 |
| OCZ Vertex 460, 480 GB | 345,43 |
| Plextor M5 Pro Xtreme, 128 GB | 344,82 |
| Crucial M500 SSD, 480 GB | 334,29 |
| OCZ Vertex 460, 240 GB | 318,44 |
| OCZ ARC 100, 240 GB | 306,57 |
| OCZ Vector 150, 120 GB | 304,30 |
| Plextor M5S, 256 GB | 279,70 |
| ADATA Premier Pro SP900, 256 GB | 235,00 |
| Intel SSD 335 Series, 240 GB | 204,39 |
| ADATA XPG SX900, 256 GB | 194,49 |
| Kingston HyperX 3K SSD, 120 GB | 137,54 |
| Kingston SSDNow V300, 120 GB | 81,28 |
| Angaben in MB/sec (mehr ist besser) | |
| write, Mittelwert | |
| Samsung SSD 840 EVO, 1 TB | 287,85 |
| Plextor M5 Pro Xtreme, 256 GB | 282,44 |
| Plextor M6S, 256 GB | 275,21 |
| OCZ Vector 150, 480 GB | 270,38 |
| Crucial M500 SSD, 480 GB | 267,18 |
| OCZ Vertex 460, 480 GB | 264,27 |
| OCZ Vertex 460, 240 GB | 264,13 |
| OCZ Vector 150, 120 GB | 259,67 |
| OCZ ARC 100, 240 GB | 256,76 |
| Plextor M5S, 256 GB | 256,72 |
| Plextor M5 Pro Xtreme, 128 GB | 250,21 |
| Intel SSD 335 Series, 240 GB | 220,48 |
| ADATA XPG SX900, 256 GB | 206,03 |
| ADATA Premier Pro SP900, 256 GB | 204,60 |
| Kingston HyperX 3K SSD, 120 GB | 189,05 |
| Kingston SSDNow V300, 120 GB | 122,82 |
| Angaben in MB/sec (mehr ist besser) | |
| read, Mittelwert | |
| Crucial M500 SSD, 480 GB | 0,05 |
| OCZ Vector 150, 120 GB | 0,05 |
| OCZ Vertex 460, 240 GB | 0,05 |
| Plextor M5 Pro Xtreme, 128 GB | 0,05 |
| Plextor M5 Pro Xtreme, 256 GB | 0,05 |
| Plextor M6S, 256 GB | 0,05 |
| Samsung SSD 840 EVO, 1 TB | 0,05 |
| OCZ ARC 100, 240 GB | 0,06 |
| Plextor M5S, 256 GB | 0,06 |
| OCZ Vertex 460, 480 GB | 0,07 |
| OCZ Vector 150, 480 GB | 0,08 |
| ADATA Premier Pro SP900, 256 GB | 0,11 |
| Intel SSD 335 Series, 240 GB | 0,14 |
| Kingston HyperX 3K SSD, 120 GB | 0,16 |
| ADATA XPG SX900, 256 GB | 0,20 |
| Kingston SSDNow V300, 120 GB | 0,20 |
| Angaben in Millisekunden (weniger ist besser) | |
| write, Mittelwert | |
| OCZ ARC 100, 240 GB | 0,05 |
| OCZ Vector 150, 120 GB | 0,05 |
| OCZ Vector 150, 480 GB | 0,05 |
| OCZ Vertex 460, 240 GB | 0,05 |
| OCZ Vertex 460, 480 GB | 0,05 |
| Samsung SSD 840 EVO, 1 TB | 0,05 |
| Crucial M500 SSD, 480 GB | 0,06 |
| Plextor M5 Pro Xtreme, 128 GB | 0,06 |
| Plextor M5 Pro Xtreme, 256 GB | 0,06 |
| Plextor M6S, 256 GB | 0,06 |
| Plextor M5S, 256 GB | 0,07 |
| ADATA Premier Pro SP900, 256 GB | 0,20 |
| Intel SSD 335 Series, 240 GB | 0,21 |
| ADATA XPG SX900, 256 GB | 0,22 |
| Kingston HyperX 3K SSD, 120 GB | 0,24 |
| Kingston SSDNow V300, 120 GB | 0,31 |
| Angaben in Millisekunden (weniger ist besser) | |
RAM spielt eine zentrale Rolle beim Gaming, da es dafür sorgt, dass dein System die großen Datenmengen moderner Spiele zuverlässig...
Wenn eine neue Grafikkarte erscheint, wird aus nüchterner Hardware-Begeisterung schnell ein kleiner Ausnahmezustand. Tests werden gelesen, Benchmarks verglichen, Shops aktualisiert,...
Moderne Gaming PCs liefern immer mehr Leistung, doch ohne gutes Kühlungsdesign können hohe Temperaturen, laute Lüfter und instabile Taktraten den...
Die Geschichte der Online-Unterhaltung ist eng mit der Entwicklung von Computern, Internetverbindungen und mobilen Geräten verbunden. Was heute selbstverständlich erscheint...
ASUS erweitert sein ProArt-Portfolio um die neue ProArt GeForce RTX 5090. Die Grafikkarte richtet sich an Kreativprofis, KI-Entwickler und Anwender...
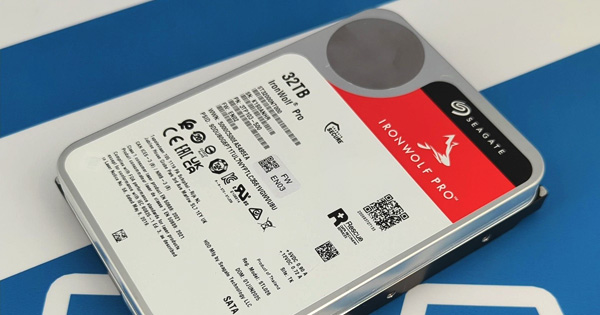
Die Familie der IronWolf Pro Festplatten von Hersteller Seagate adressiert vor allem NAS-Systeme im Profi-Segment. Wir haben uns das aktuelle Flaggschiff der CMR-Plattform mit satten 32 TB im Praxistest zur Brust genommen.
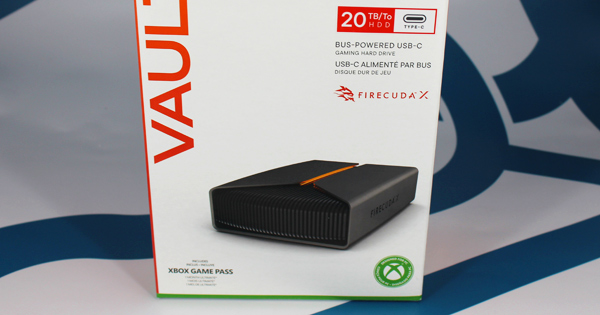
Mit der FireCuda X Vault präsentiert Seagate eine neue externe Festplatte, die vollständig über USB-C versorgt wird und bis zu satte 20 TB bietet. LED-Beleuchtung und ein passendes Toolkit runden das Gesamtpaket ab.
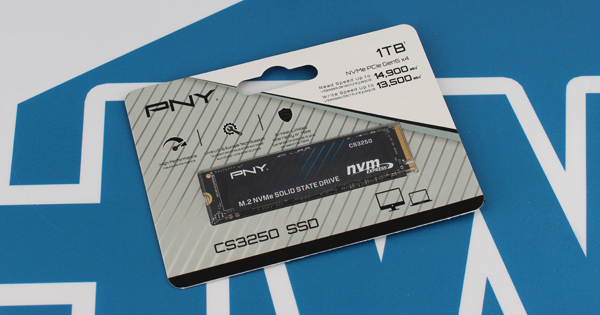
PNY bietet mit der CS3250 eine Familie von PCIe Gen5 SSDs an, die mit Speicherkapazitäten von bis zu 4 TB erhältlich sind. Die Drives erreichen bis zu 14.900 MB/s lesend. Wir haben das 1-TB-Modell getestet.